You can view the overall system status, a list of outstanding
events that require immediate attention, and the overall status of
all chassis components on the System Status page.
The Chassis Management
Module web interface opens to the System Status
page. The top right of the page identifies the current user and contains
a Settings menu, Logout and Help options, and
the current time and date from the CMM.
The remaining content of this page and other web interface pages vary
according to the type of Flex System Enterprise
Chassis that
you are using and the firmware versions and options that are installed.
See Starting the web interface for detailed information
about opening CMM web
interface.
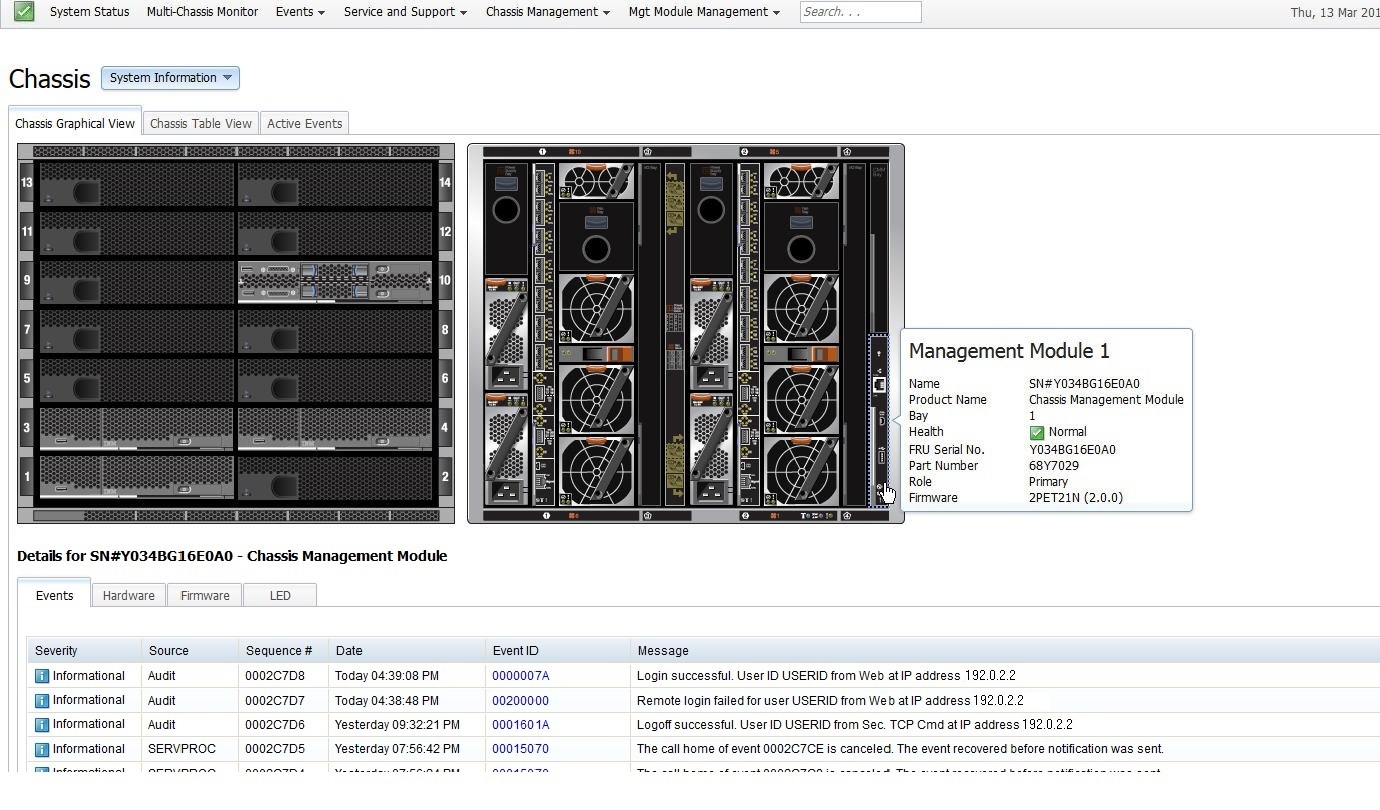
The Chassis Graphical View tab is the default view
on the System Status page. The Chassis Graphical View contains an
interactive graphic of the front and rear view of the chassis. Each
component shows a color-coded overall status to indicate any problems
that might exist for that device, with green indicating normal operation,
yellow indicating that a non-critical event has occurred, and red
indicating that a critical event has occurred. You can move the pointer
over an individual component to display some general information about
it. Click the component to view or hide detailed information contained
in a table below the system graphic. Right-click the component to
display a context menu of options available for that component. Click
the Chassis Table View tab to change the view from the interactive
graphical format to tabular format. The option to export the tabular
information in CSV, XML, or PDF format is available from the Chassis
Table View.
The following illustration shows the System Status
page of the CMM web
interface.
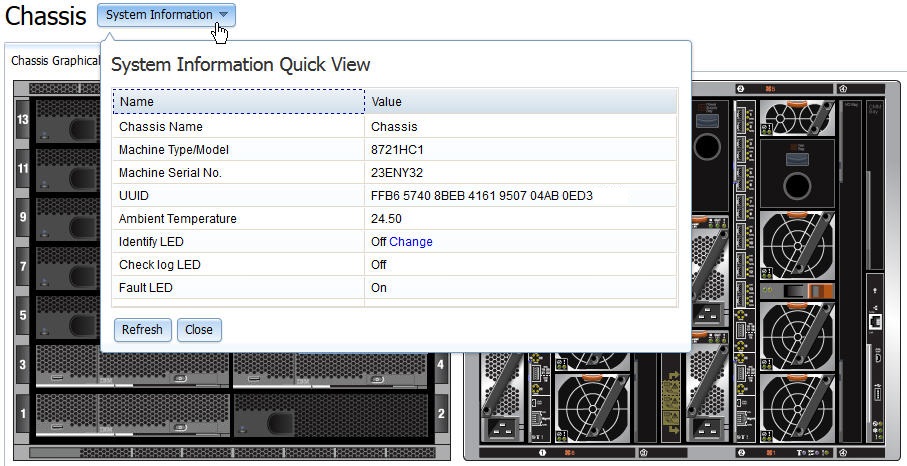
Click System Information to display some general
information about the chassis. To rename the chassis, click the current
chassis name, then enter a new name. For example, in the illustration
you would click on the current chassis name, Chassis, to change
the name.
Note: The
graphic used to represent a chassis bay filler is similar in color
to the graphic that is used for components that are installed in the
chassis. When viewing the graphic, you can move the pointer over a
chassis bay or component to view more information about it.
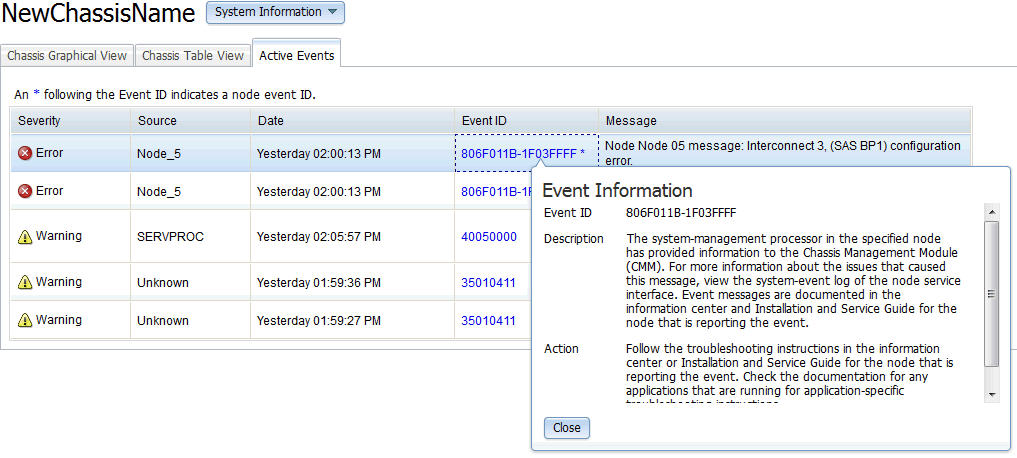
The Active
Events tab on the System Status page displays events that might
affect the performance of the chassis. The following graphic illustrates
the Active Events tab after you click the Event ID number.
The following table describes the
options that are available from the System Status page.
The System
Status menu table is a multi-row, three-column table that contains
descriptions of all the web interface options that are accessible
from the System Status page. Column one contains the navigation bar
option. Column two contains the menu items that are available from
the navigation bar option. Column three contains the options and their
descriptions that are available under the menu items.
| Navigation bar option |
Selection |
Description |
| System Status |
|
The System Status page contains
an overall view of the chassis status and information about the components
in the chassis. Click System Information to open a window that
displays general system inventory information, an ambient temperature
reading, and options to control the identify, check log, and fault
LEDs. To rename the chassis, click on the current name of the chassis
and enter a new one, with up to 15 alphanumeric characters.
|
| Chassis tab |
The Chassis tab displays health information
for individual components in a table or graphical view.
(continued on the next page) |
| System Status |
Chassis tab |
- Chassis Graphical View(continued)
- Hardware - A component hierarchy tree on the left panel
enables you to select a component and view the selected component's
inventory information on the right panel. Expand a parent component
(component with a +/-) box to show any associated child components.
Click a parent component to view information about the component,
including a table that contains the child components and inventory
information about each child component. Click the lowest level child
component (without a +/-) in the hierarchical tree to view its full
inventory data.
- Firmware - Information about the component firmware. Components
for which multiple firmware instances are installed will have the
information contained in a table.
- Power - The following power information about the selected
component:
- State - Indicates whether the device is powered on or off.
- Allocation - Minimum and maximum power that is allocated
for the component.
- Consumption History - Power consumption of the component
for up to the past 24 hours.
- Environmentals - Temperature and voltage information for
the selected component. Some components might also provide one or
more threshold values.
- IO Connectivity - Compatibility information about the selected
component and any internally connected I/O modules. This tab also
provides information about the internal connectivity status between
I/O modules and the network adapter of the component.
- SOL Status - Information about the Serial over LAN connection
and configuration of the component.
- Boot Sequence - Applies only to compute nodes and enables
the user to select the boot order of components that the selected
compute node will use when starting up. The following attributes are
available for each device:
- Device ID - Numeric identifier for the device.
- Active - Information about whether a device is active and
can be used in the boot order.
- Presence - Information about the presence of a device.
A missing device can be used in the boot order. When the device is
present, it is booted in the order in which it was configured.
- Device Label - Label provided by the device.
- User Label - Label provided by the user.
- Order - Location in the boot order.
- LEDs - LEDs that are present on the selected component.
All of the LED information viewed from the chassis graphical view
property tabs is read-only. The state of some LEDs can be changed
through the Chassis Management menu.
- Boot Mode - Applies only to compute nodes and indicates
the following information:
- Active boot mode - Location of the active copy of the compute
node firmware, either the temporary bank or the permanent bank.
- Pending boot mode - Location where the compute node firmware
can be obtained upon the next restart, either the temporary bank or
the permanent bank
- Port info - Applies only to I/O modules and provides information
about each switch port.
|
 , Attention
  , Normal